这是本系列第三篇文章,主要涉及如何将 matplotlib 与 PyQt 结合,PyQt 的信号以及 PyQt 中多线程、多进程的使用
上节中我演示了如何创建一个主界面和两个子界面并通过按钮和槽函数将三者联系到一起,以及如何为软件绑定快捷键,监听关闭事件 (closeEvent)。现在我们想让用户打开子界面时主界面会隐藏起来,在关闭子界面后主界面再次弹出,防止多余的窗口造成不必要的麻烦。
首先需要设置显示子界面的槽函数,使其可以隐藏主界面
1 2 3 4 5 6 7 8 9 10 11 12 13 14 15 16 17 18 class MainWindow (QMainWindow ): def show_ppi (self ): if self .ppi_window is not None : self .ppi_window.deleteLater() self .ppi_window = PPIWindow() self .ppi_window.show() self .hide() def show_rhi (self ): if self .rhi_window is not None : self .rhi_window.deleteLater() self .rhi_window = RHIWindow() self .rhi_window.show() self .hide()
为了让主界面可以获知子界面已经关闭,我们使用 PyQt 的 信号 进行通讯。PyQt 的信号非常好用,尤其在多线程和多进程通讯方面。
尽管 Python 有队列 (Queue)用于线程和进程间通讯,在 PyQt 中请尽量信号进行通讯,这可以保证 Qt 程序在运行中不会出现意外的问题。
首先在两个子界面中设置关闭信号,并设置在关闭界面时触发
1 2 3 4 5 6 7 8 9 10 11 12 13 14 15 16 17 18 19 20 21 22 23 24 from PyQt5.QtCore import pyqtSignal class PPIWindow (QMainWindow ): close_signal = pyqtSignal() def __init__ (self ): def closeEvent (self, QCloseEvent ): self .close_signal.emit() QCloseEvent.accept() from PyQt5.QtCore import pyqtSignalclass RHIWindow (QMainWindow ): close_signal = pyqtSignal() def __init__ (self ): def closeEvent (self, QCloseEvent ): self .close_signal.emit() QCloseEvent.accept()
然后定义好信号的槽函数,并在实例化时进行绑定
1 2 3 4 5 6 7 8 9 10 11 12 13 14 15 16 17 18 19 20 21 22 23 class MainWindow (QMainWindow ): def show_ppi (self ): if self .ppi_window is not None : self .ppi_window.deleteLater() self .ppi_window = PPIWindow() self .ppi_window.close_signal.connect(self .close_signal_slot) self .ppi_window.show() self .hide() def show_rhi (self ): if self .rhi_window is not None : self .rhi_window.deleteLater() self .rhi_window = RHIWindow() self .rhi_window.close_signal.connect(self .close_signal_slot) self .rhi_window.show() self .hide() def close_signal_slot (self ): self .show()
现在主界面将在打开子界面时隐藏,并在退出子界面时重新显示
以下仅以 ppi.py 及对应 .ui 文件为例,rhi.py 情况相同。
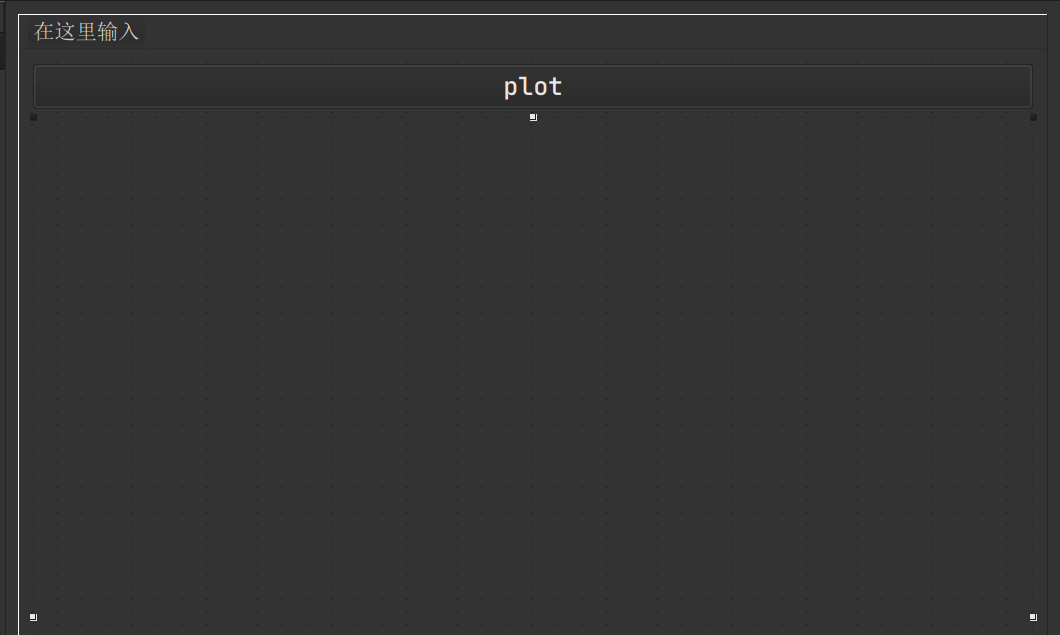
首先先在子界面中添加一个 800*800 固定大小 (将部件的最小尺寸和最大尺寸设置为同样的值即可) 的 QWidget 部件,命名为 canvas_widget,这个部件将会用来放置画布。然后在其上添加一个按钮命名为 plot,这个按钮将用来触发画图事件。最后对整个窗口使用栅格布局使其部件自动对齐。
碍于篇幅这里就不截全图了
然后我们要用 matplotlib 提供的 FigureCanvasQTAgg 类来创建一个可以在 PyQt 中使用的 Figure。
1 2 3 4 5 6 7 8 9 10 11 12 13 14 15 16 17 18 19 20 21 22 23 24 25 26 27 28 29 30 31 32 33 34 35 36 37 38 39 40 41 42 import matplotlibfrom matplotlib.backends.backend_qt5agg import FigureCanvasQTAggfrom matplotlib.figure import Figureimport matplotlib.transforms as mtransformsmatplotlib.use("Qt5Agg" ) class CreateCanvas (FigureCanvasQTAgg ): """ 新定义一个 FigureCanvasQTAgg 的子类,在子类中创建 figure、ax以及cax """ def __init__ (self, figsize=(4 , 3 100 , colorbar_pad=0.02 , colorbar_width=0.01 ): self .cax = None self .axes = None self .fig = Figure(figsize, dpi) super (CreateCanvas, self ).__init__(self .fig) self .create_axes(colorbar_pad, colorbar_width) self .colorbar_pad = colorbar_pad self .colorbar_width = colorbar_width def create_axes (self, colorbar_pad, colorbar_width ): self .axes = self .fig.add_subplot(111 ) axes_position = self .axes.get_position() cax_position = mtransforms.Bbox.from_extents( axes_position.x1 + colorbar_pad, axes_position.y0, axes_position.x1 + colorbar_pad + colorbar_width, axes_position.y1 ) self .cax = self .axes.figure.add_axes(cax_position) def clear_figure (self ): self .fig.clf() self .create_axes(self .colorbar_pad, self .colorbar_width)
可以看到,CreateCanvas 最后初始化了三个对象,fig,axes 以及 cax,画图时使用 axes 画图即可,其拥有的方法与平时在 matplotlib 中使用的子图 ax 一致。
然后我们需要在 PPIWindow 中将绘图部件添加到 canvas_widget 上,顺便定义一下画图函数,就画个简单的正弦函数吧。
1 2 3 4 5 6 7 8 9 10 11 12 13 14 15 16 17 18 19 20 21 22 23 24 25 26 from PyQt5.QtWidgets import QGridLayoutimport numpy as npclass PPIWindow (QMainWindow ): def __init__ (self ): self .grid_layout = QGridLayout(self .ui.canvas_widget) self .figure = CreateCanvas() self .grid_layout.addWidget(self .figure) self .ui.plot.clicked.connect(self .plot_sin) def plot_sin (self ): self .figure.clear_figure() t = np.arange(0 , 5 , 0.01 ) s = np.sin(2 * np.pi * t) self .figure.axes.plot(t, s) self .figure.draw()
运行程序,点击 plot,画布即可显示出正弦函数图像
有时我们需要绘制的并不是简单的正弦函数图像,在这种情况下为了保证 UI 界面的更新不会被阻塞 (主线程不会被阻塞),将执行时间长的任务交给其他线程或者进程是最好的解决方案。
应尽量避免跨线程更新 UI,这会导致程序不稳定,容易发生意外的错误。理想的程序设计应该是主线程只负责更新 UI,所有其他任务交由其他线程或进程处理。
PyQt 有一个 QThread 类可以执行多线程的操作,新定义一个类继承自 QThread 并重写其 run 方法即可。
这里我们使用知名的 中国业务天气雷达开源库 pycwr 来在 UI 上绘制组合反射率,数据使用 pycwr 提供的 2015年数据 :NUIST.20150627.002438.AR2.bz2。
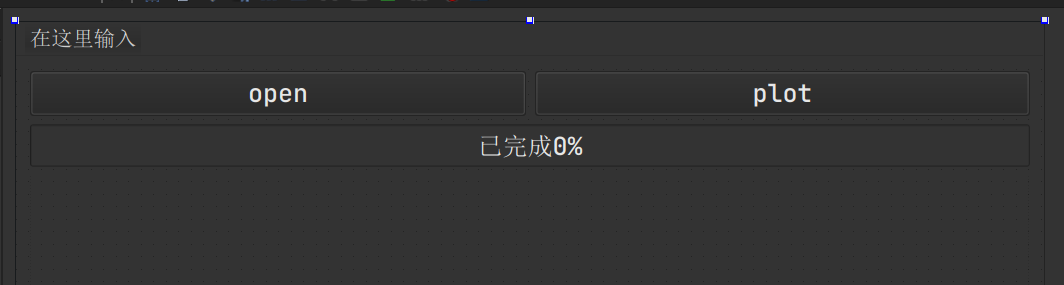
首先我们再添加一个按钮和槽函数,用来打开雷达数据文件,并添加一个进度条显示进度
当然这里进度条显示的并不是实际的进度,而是每隔一段固定时间均匀增长的进度条,它的作用主要是用来告诉用户 “程序正在运行,请耐心等待”
接下来添加 open 按钮的槽函数,这里将打开文件的行为交由子线程进行处理,并通过信号返回读取好的数据
1 2 3 4 5 6 7 8 9 10 11 12 13 14 15 16 17 18 19 20 21 22 23 24 25 26 27 28 29 30 31 32 33 34 35 36 37 38 39 40 41 42 43 44 45 46 47 48 49 50 51 52 53 54 55 56 57 58 59 60 61 62 63 64 65 66 67 68 69 70 71 72 73 74 75 76 77 78 79 80 81 82 83 84 85 86 87 88 89 90 91 92 93 94 95 96 from PyQt5.QtCore import QThreadfrom pycwr.io import read_autoclass OpenFile (QThread ): open_file_finish_signal = pyqtSignal(dict ) set_progress_bar_100_signal = pyqtSignal() def __init__ (self, filename ): super (OpenFile, self ).__init__() self .filename = filename def run (self ): data = read_auto(self .filename) self .open_file_finish_signal.emit({'data' : data}) self .set_progress_bar_100_signal.emit() class ProgressBar (QThread ): set_progress_bar_signal = pyqtSignal(int ) def __init__ (self, sleep_time: float ): super (ProgressBar, self ).__init__() self .stop_flag = False self .sleep_time = sleep_time def run (self ): value = 0 while value < 99 : if self .stop_flag: break value += 1 self .set_progress_bar_signal.emit(value) sleep(self .sleep_time) def stop_thread (self ): self .stop_flag = True class PPIWindow (QMainWindow ): def __init__ (self ): self .thread_control = {} self .ui.open .clicked.connect(self .open_file_button_slot) def open_file_signal_slot (self, data: dict ): self .radar_data = data['data' ] def set_progress_bar_signal_slot (self, value: int ): self .ui.progressBar.setValue(value) def set_progress_bar_100_signal_slot (self ): if self ._check_thread('ProgressBar' ): self .thread_control['ProgressBar' ].stop_thread() self .set_progress_bar_signal_slot(100 ) def open_file_button_slot (self ): if self ._check_thread('OpenFile' ): return filename = QFileDialog.getOpenFileName(self , "选择数据" , "./" , "bz2压缩文件(*.bz2);;所有文件(*)" )[0 ] if filename == '' : return self ._start_progress_bar(sleep_time=0.3 ) self .thread_control['OpenFile' ] = OpenFile(filename) self .thread_control['OpenFile' ].open_file_finish_signal.connect(self .open_file_signal_slot) self .thread_control['OpenFile' ].set_progress_bar_100_signal.connect(self .set_progress_bar_100_signal_slot) self .thread_control['OpenFile' ].start() def _start_progress_bar (self, sleep_time=0.25 ): if self ._check_thread('ProgressBar' ): self .thread_control['ProgressBar' ].stop_thread() self .thread_control['ProgressBar' ] = ProgressBar(sleep_time) self .thread_control['ProgressBar' ].set_progress_bar_signal.connect(self .set_progress_bar_signal_slot) self .thread_control['ProgressBar' ].start() def _check_thread (self, name: str ): if name in self .thread_control.keys() and self .thread_control[name].isRunning(): return True else : return False
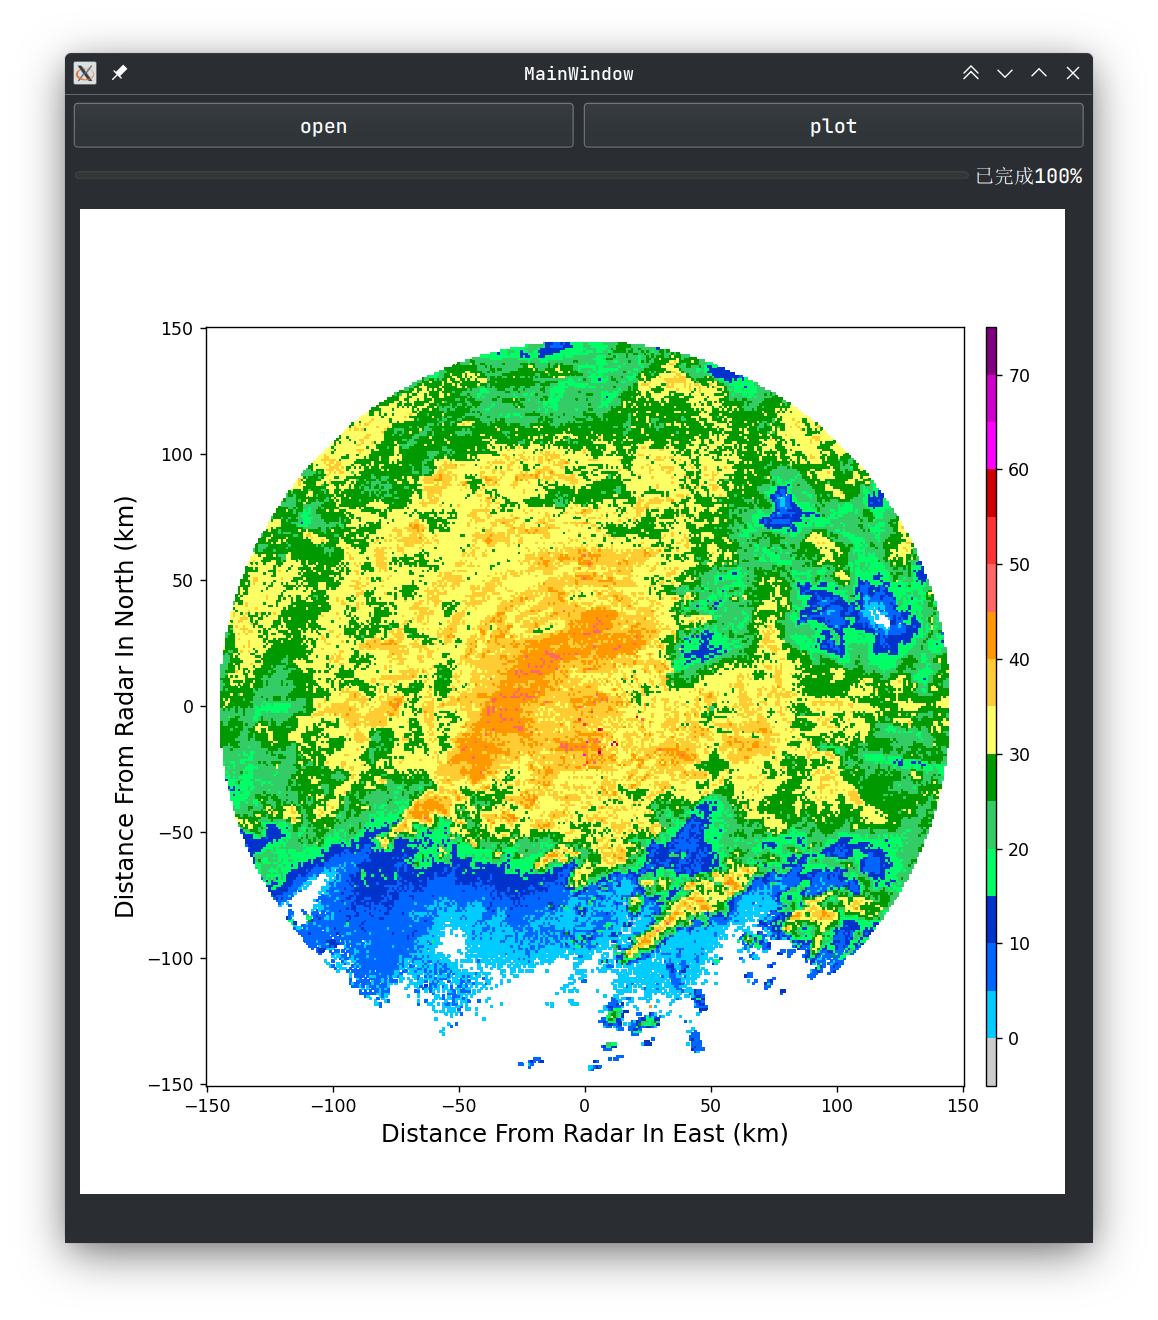
现在可以尝试读取雷达数据了,进度条将在数据读取完成后走到 100%
新建一个 backend/backend.py 文件,将画图功能单独分离出来。参照 官方教程 绘制笛卡尔坐标的组合反射率,但是这里做出了一些修改,为了避免子线程更新主线程属性带来意外问题,将 add_product_CR_xy 函数进行拆解,直接获取绘图需要用到的数据,并将计算数据的部分交由子进程进行处理。
使用子进程来计算绘图数据是因为由于 GIL 锁的原因,在数据量较大时,计算数据的部分对 CPU 的占用会导致 UI 界面更新受到影响,因此通过使用子进程的方式将数据的计算交由其他核进行处理。
1 2 3 4 5 6 7 8 9 10 11 12 13 14 15 16 17 18 19 20 21 22 23 24 25 26 27 28 29 30 31 32 33 34 35 36 37 38 39 40 41 42 43 44 45 46 47 48 49 50 51 52 53 from pycwr.draw.RadarPlot import plot_xyimport numpy as npfrom pycwr.core.NRadar import PRDfrom pycwr.core.RadarGridC import get_CR_xyimport xarray as xrfrom multiprocessing import Process, Queuefrom PyQt5.QtCore import QThread, pyqtSignaldef _get_data (queue: Queue, *args, **kwargs ): GridV = get_CR_xy(*args, **kwargs) queue.put(GridV) class PlotCR (QThread ): plot_finish_signal = pyqtSignal() def __init__ (self, canvas_figure, radar: PRD ): super (PlotCR, self ).__init__() self .fig = canvas_figure.fig self .ax = canvas_figure.axes self .cax = canvas_figure.cax self .radar = radar self .canvas_figure = canvas_figure def run (self ): x1d = np.arange(-150000 , 150001 , 1000 ) y1d = x1d.copy() GridX, GridY = np.meshgrid(x1d, y1d, indexing="ij" ) vol_azimuth, vol_range, fix_elevation, vol_value, radar_height, radar_lon_0, radar_lat_0 = self .radar.vol fillvalue = -999. q = Queue() p = Process(target=_get_data, args=(q, vol_azimuth, vol_range, fix_elevation, vol_value, radar_height, GridX.astype(np.float64), GridY.astype(np.float64), fillvalue)) p.start() GridV = q.get() p.join() product = xr.Dataset() product.coords['x_cr' ] = x1d product.coords['y_cr' ] = y1d product['CR' ] = (('x_cr' , 'y_cr' ), np.where(GridV == fillvalue, np.nan, GridV)) im = plot_xy(self .ax, GridX, GridY, product.CR, cbar=False ) self .fig.colorbar(mappable=im, cax=self .cax) self .ax.set_xlabel("Distance From Radar In East (km)" , fontsize=14 ) self .ax.set_ylabel("Distance From Radar In North (km)" , fontsize=14 ) self .canvas_figure.draw() self .plot_finish_signal.emit()
然后在 ppi.py 中进行设置
1 2 3 4 5 6 7 8 9 10 11 12 13 14 15 16 17 18 19 20 21 22 from src.backend.backend import PlotCR class PPIWindow (QMainWindow ): def __init__ (self ): self .ui.plot.clicked.connect(self .plot_CR) def plot_CR (self ): if self ._check_thread('PlotCR' ): return if self .radar_data is None : return if self ._check_thread('ProgressBar' ): self .thread_control['ProgressBar' ].stop_thread() self ._start_progress_bar(sleep_time=0.35 ) self .thread_control['PlotCR' ] = PlotCR(self .figure, self .radar_data) self .thread_control['PlotCR' ].plot_finish_signal.connect(self .set_progress_bar_100_signal_slot) self .thread_control['PlotCR' ].start()
现在可以尝试进行绘制组合反射率图像了。
由于代码量的逐渐增多,最后就不放出全部的代码了,将在本系列最后给出 全部代码 的地址,看官自行 clone。
Comments